
Page 109 - Revista del Centro de Investigación y Desarrollo del INEI - Economía, Sociedad y Estadística N° 9
P. 109
11.2. INCOME INEQUALITY AND REDISTRIBUTION
11.2. INCOME INEQUALITY AND REDISTRIBUTION
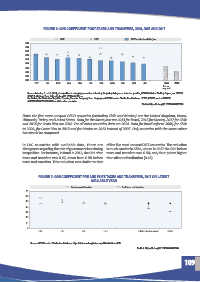
FIGURE 6: GINI COEFFICIENT POST-TAXES AND TRANSFERS, 2000, 2007 AND 2017
11.4. Gini coefficient post-taxes and transfers, 2000, 2007 and 2017 or latest available year
11.4. Gini coefficient post-taxes and transfers, 2000, 2007 and 2017 or latest available year
2000 2007 2017 or latest available year
2000 2007 2017 or latest available year
0.65
0.65
0.60
0.60
0.55
0.55
0.50
0.50
0.45
0.45
0.40
0.40
0.35
0.35
0.30
0.30
0.25
0.25
0.20
0.20
PRY CRI MEX PAN BRA CHL BOL DOM ECU PER URY OECD OECD
PRY CRI MEX PAN BRA CHL BOL DOM ECU PER URY OECD OECD
5 most
5 most
unequal
unequal
Source: balestra, C., et al. (2018), «inequalities in emerging economies: informing the policy dialogue on inclusive growth», OECD Statistics Working
Source: balestra, C., et al. (2018), «inequalities in emerging economies: informing the policy dialogue on inclusive growth», OECD Statistics Working Papers, no. 2018/13,
Source: balestra, C., et al. (2018), «inequalities in emerging economies: informing the policy dialogue on inclusive growth», OECD Statistics Working
Papers, no. 2018/13, OECD Publishing, Paris, https://doi.org/10.1787/6c0db7fb-en.for bolivia, the Dominican republic, Ecuador, Panama, Paraguay, Peru,
OECD Publishing, Paris, https://doi.org/10.1787/6c0db7fb-en.
Papers, no. 2018/13, OECD Publishing, Paris, https://doi.org/10.1787/6c0db7fb-en.for bolivia, the Dominican republic, Ecuador, Panama, Paraguay, Peru,
Uruguay and OECD income Distribution Database, https://stats.oecd.org/Index.aspx?DataSetCode=IDD for all the other countries.
For Bolivia, the Dominican Republic, Ecuador, Panama, Paraguay, Peru, Uruguay and OECD income Distribution Database, HTTPS://STATS.oecd.orG/INDEX.
Uruguay and OECD income Distribution Database, https://stats.oecd.org/Index.aspx?DataSetCode=IDD for all the other countries.
ASPX?DATASETCODE=IDD for all the other countries. 12 https://doi.org/10.1787/888934093386
12 https://doi.org/10.1787/888934093386
Statlink https://doi.org/10.1787/888934093386
11.5. Ratio S80/S20, 2000, 2007 and 2017 or latest available year
11.5. Ratio S80/S20, 2000, 2007 and 2017 or latest available year
2000 2007 2017 or latest year available
2000
2017 or latest year available
2007
Note: the five most unequal OECD countries (excluding Chile and Mexico) are the United Kingdom, Korea,
40
40
Lithuania, Turkey and United States. Data for the latest year are 2013 for Brazil, 2016 for Mexico, 2017 for Chile
35
35
and 2018 for Costa Rica are 2018. For all other countries data are 2014. Data for Brazil refer to 2006, for Chile
30
30
to 2009, for Costa Rica to 2010 and for Mexico to 2012 instead of 2007. Only countries with the same colour
25
25
bar should be compared.
20
20
15
15
In LAC countries with available data, there are of the five most unequal OECD countries. The reduction
10
10
divergences regarding the role of government in reducing is much smaller in Chile, where in 2017 the Gini before
5
5
inequalities. For instance, in Brazil in 2013, the Gini after taxes and transfers was 0.50, only four points higher
0
0
taxes and transfers was 0.47, down from 0.58 before than after redistribution (0.46). OECD OECD
PRY
BRA
ECU
URY
PAN
CRI
DOM
BOL
PER
MEX
CHL
PAN
BRA
MEX
CRI
CHL
BOL
DOM
ECU
PRY
OECD
OECD
URY
PER
5 most
5 most
taxes and transfers. This reduction was similar to that unequal
unequal
Source: balestra, C., et al. (2018), «inequalities in emerging economies: informing the policy dialogue on inclusive growth», OECD Statistics Working
Source: balestra, C., et al. (2018), «inequalities in emerging economies: informing the policy dialogue on inclusive growth», OECD Statistics Working
Papers, no. 2018/13, OECD Publishing, Paris, https://doi.org/10.1787/6c0db7fb-en.for bolivia, the Dominican republic, Ecuador, Panama, Paraguay, Peru,
Papers, no. 2018/13, OECD Publishing, Paris, https://doi.org/10.1787/6c0db7fb-en.for bolivia, the Dominican republic, Ecuador, Panama, Paraguay, Peru,
Uruguay and OECD income Distribution Database, https://stats.oecd.org/Index.aspx?DataSetCode=IDD for all the other countries.
Uruguay and OECD income Distribution Database, https://stats.oecd.org/Index.aspx?DataSetCode=IDD for all the other countries.
FIGURE 7: GINI COEFFICIENT PRE AND POST-TAXES AND TRANSFERS, 2017 OR LATEST
12 https://doi.org/10.1787/888934093405
12 https://doi.org/10.1787/888934093405
AVAILABLE YEAR
11.6. Gini coefficient pre and post-taxes and transfers, 2017 or latest available year
11.6. Gini coefficient pre and post-taxes and transfers, 2017 or latest available year
Pre-taxes and transfers Post-taxes and transfers
Pre-taxes and transfers Post-taxes and transfers
0.7
0.7
0.6
0.6
0.5
0.5
0.4
0.4
0.3
0.3
0.2
0.2
0.1
0.1
0
0
BRA CRI CHL MEX OECD 5 most unequal OECD
BRA CRI CHL MEX OECD 5 most unequal OECD
Source: OECD income Distribution Database, https://stats.oecd.org/Index.aspx?DataSetCode=IDD
Source: OECD income Distribution Database, https://stats.oecd.org/Index.aspx?DataSetCode=IDD
12 https://doi.org/10.1787/888934093424
12 https://doi.org/10.1787/888934093424
Source: OECD Income Distribution Database, https://stats.oecd.org/Index.aspx?DataSetCode=IDD.
GOvErnmEnt At A GLAnCE: LAtin AmEriCA AnD thE CAribbEAn 2020 © OECD 2020 169
GOvErnmEnt At A GLAnCE: LAtin AmEriCA AnD thE CAribbEAn 2020 © OECD 2020 Statlink https://doi.org/10.1787/888934093424 169
109