
Page 113 - Revista del Centro de Investigación y Desarrollo del INEI - Economía, Sociedad y Estadística N° 9
P. 113
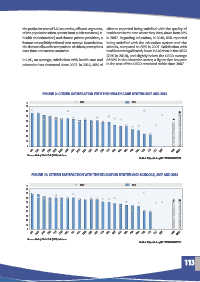
the particular case of LAC countries, affluent segments,  citizens reported being satisfied with the quality of
              of the population often opt out from public services (i.e.  health care in the area where they lived, down from 55%
              health and education) and choose private providers, a  in 2007. Regarding education, in 2018, 63% reported
              feature not explicitly referred to in surveys. Nonetheless,  being satisfied with the education system and the
              the dataset allows for comparison of citizen perceptions  schools, compared to 65% in 2007. Satisfaction with
              over time and across countries.                   health care is significantly lower in LAC than in the OECD
                                                                (70% in 2018), and slightly below the OECD average
              In LAC, on average, satisfaction with health care and  of 66% in the education sector, a figure that however
              education has decreased since 2007. In 2018, 49% of  in the case of the OECD remained stable since 2007.


                                                              11.4. CITIZEN SATISFACTION WITH PUBLIC SERVICES AND INSTITUTIONS

                          FIGURE 9: CITIZEN SATISFACTION WITH THE HEALTH CARE SYSTEM 2007 AND 2018
                                 11.10. Citizen satisfaction with the health care system 2007 and 2018
                                                              11.4. CITIZEN SATISFACTION WITH PUBLIC SERVICES AND INSTITUTIONS
                                                2007                           2018
                %
                80
                                 11.10. Citizen satisfaction with the health care system 2007 and 2018
                70
                %
                60                              2007                           2018
                80
                50
                70
                40
                60
                30
                50
                20
                40
                10
                30
                 0
                20  CRI  URY  NIC  PAN  MEX  DOM  JAM  ARG  GTM  HND  PRY  TTO  ECU  SLV  BOL  COL  CHL  PER  BRA  VEN  HTI  BLZ  GUY  LAC  OECD
                10
                 Source: Gallup World Poll (2019) database.
               Source: Gallup World Poll (2019) database.
                                                                                    Statlink  https://doi.org/10.1787/888934093500
                 0                                                           12 https://doi.org/10.1787/888934093500
                   CRI  URY  NIC  PAN  MEX  DOM  JAM  ARG  GTM  HND  PRY  TTO  ECU  SLV  BOL  COL  CHL  PER  BRA  VEN  HTI  BLZ  GUY  LAC  OECD
                            11.11. Citizen satisfaction with the education system and schools, 2007 and 2018
               Source: Gallup World Poll (2019) database.
                                                                             12 https://doi.org/10.1787/888934093500
                                                                               2018
                                                2007
                %  FIGURE 10: CITIZEN SATISFACTION WITH THE EDUCATION SYSTEM AND SCHOOLS, 2007 AND 2018
                90
                            11.11. Citizen satisfaction with the education system and schools, 2007 and 2018
                80
                70 %                            2007                           2018
                90
                60
                80
                50
                70
                40
                60
                30
                50
                20
                40
                10
                30
                 0
                20  CRI  DOM  JAM  ECU  SLV  GTM  HND  NIC  BOL  MEX  PAN  PRY  TTO  COL  URY  ARG  CHL  PER  BRA  VEN  HTI  BLZ  GUY  LAC  OECD
                10
               Source: Gallup World Poll (2019) database.
                 0                                                           12 https://doi.org/10.1787/888934093519
                   CRI  DOM  JAM  ECU  SLV  GTM  HND  NIC  BOL  MEX  PAN  PRY  TTO  COL  URY  ARG  CHL  PER  BRA  VEN  HTI  BLZ  GUY  LAC  OECD
                                11.12. Citizen confidence in the judiciary and the courts, 2007 and 2018
               Source: Gallup World Poll (2019) database.
                 Source: Gallup World Poll (2019) database.                  12 https://doi.org/10.1787/888934093519
                %                               2007                           2018  Statlink  https://doi.org/10.1787/888934093519
                60
                                11.12. Citizen confidence in the judiciary and the courts, 2007 and 2018
                50
                %                               2007                           2018
                60
                40                                                                                            113
                50
                30
                40
                20
                30
                10
                20
                 0
                   GTM  CRI  HND  HTI  URY  BRA  ECU  SLV  PRY  MEX  PAN  DOM  NIC  JAM  TTO  COL  ARG  CHL  VEN  BOL  PER  BLZ  GUY  LAC  OECD
                10
               Source: Gallup World Poll (2019) database.
                 0                                                           12 https://doi.org/10.1787/888934093538
                   GTM  CRI  HND  HTI  URY  BRA  ECU  SLV  PRY  MEX  PAN  DOM  NIC  JAM  TTO  COL  ARG  CHL  VEN  BOL  PER  BLZ  GUY  LAC  OECD
               Source: Gallup World Poll (2019) database.
                                                                                                            173
               GOvErnmEnt At A GLAnCE: LAtin AmEriCA AnD thE CAribbEAn 2020 © OECD 2020  12 https://doi.org/10.1787/888934093538
               GOvErnmEnt At A GLAnCE: LAtin AmEriCA AnD thE CAribbEAn 2020 © OECD 2020                     173