
Page 105 - Revista del Centro de Investigación y Desarrollo del INEI - Economía, Sociedad y Estadística N° 9
P. 105
E. FISCAL REVENUES FROM NON-RENEWABLE
NATURAL RESOURCES (NRNR)
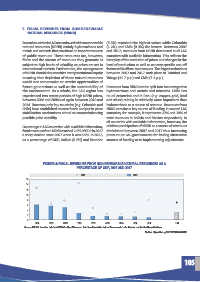
Several countries in LAC are endowed with nonrenewable (5.6%) reported the highest values while Colombia
natural resources (NRNR) mainly hydrocarbons and (1.2%) and Chile (0.9%) the lowest. Between 2007
metals and minerals that constitute an important source and 2017, revenues from NRNR decreased in all LAC
of public revenues. These resources are, however, countries with available information. This reflects the
finite and the stream of revenues they generate is interplay of the evolution of prices and changes in the
subject to high levels of volatility, as prices are set in level of production as well as country specific one-off
international markets. Furthermore, the management factors with effects on revenues. The largest reductions
of NRNR should also consider intergenerational equity between 2007 and 2017 took place in Trinidad and
ensuring that depletion of these natural resources Tobago (11.7 p.p.) and Chile (7.1 p.p.).
would not compromise or restrict opportunities of
future generations as well as the sustainability of Revenues from NRNR can be split into two categories:
the environment. As a whole, the LAC region has hydrocarbons and metals and minerals. Chile has
experienced two recent periods of high NRNR prices, no oil extraction and in Peru (e.g. copper, gold, lead
between 2006 and 2008 and again between 2010 and and silver) mining is relatively more important than
2014. However, only few countries (e.g. Colombia and hydrocarbons as a source of revenue. Revenues from
Chile) have established reserve funds and put in place NRNR remains a key source of funding in several LAC
stabilisation mechanisms aimed at counterbalancing countries, for example, it represents 32% and 28% of
possible price volatility. total revenues in Bolivia and Mexico respectively. In
all countries with available information, however, the
On average in LAC countries with available information, relative participation of NRNR as a source of revenues
fiscal revenues from NRNR reached 2.9% of GDP in 2017 diminished between 2007 and 2017 thus increasing
a sharp decline since 2007 when it was 6.9%. In 2017, pressure on LAC governments for finding alternative
as a percentage of GDP, Bolivia (5.9%) and Ecuador sources of funding or to implementing adjustments.
2.10. FISCAL REVENUES FROM NON-RENEWABLE NATURAL RESOURCES (NRNR)
FIGURE 4: FISCAL REVENUES FROM NON-RENEWABLE NATURAL RESOURCES AS A
PERCENTAGE OF GDP, 2007 AND 2017
2.23. Fiscal revenues from non-renewable natural resources as a percentage of GDP, 2007 and 2017
2007 2017
16
14
12
10
8
6
4
2
0
BOL ECU MEX TTO PER ARG BRA COL CHL LAC
Source: ECLAC, based on data from ECLAC’s Fiscal Revenues from Non-Renewable Natural Resources in Latin America and the Caribbean Database.
Source: ECLAC, based on data from ECLAC’s Fiscal revenues from non-renewable natural resources in Latin America and the Caribbean Database.
12 https://doi.org/10.1787/888934091543
Statlink https://doi.org/10.1787/888934091543
2.24. Fiscal revenues from non-renewable resources by country and commodity as percentage of GDP,
2007 and 2017
Hydrocarbons Mining
16
14
105
12
10
8
6
4
2
0
2007 2017 2007 2017 2007 2017 2007 2017 2007 2017 2007 2017 2007 2017 2007 2017 2007 2017 2007 2017
TTO BOL CHL MEX ECU PER COL ARG BRA LAC
Source: ECLAC, based on data from ECLAC’s Fiscal revenues from non-renewable natural resources in Latin America and the Caribbean Database.
12 https://doi.org/10.1787/888934091562
2.25. Relative participation of revenues from non-renewable natural resources as a share of total revenues,
2007 and 2017
2007 2017
60
50
40
30
20
10
0
ECU MEX BOL PER COL ARG BRA CHL
Source: ECLAC, based on data from ECLAC’s Fiscal revenues from non-renewable natural resources in Latin America and the Caribbean Database.
12 https://doi.org/10.1787/888934091581
GOvErnmEnt At A GLAnCE: LAtin AmEriCA AnD thE CAribbEAn 2020 © OECD 2020 71