
Page 99 - Revista del Centro de Investigación y Desarrollo del INEI - Economía, Sociedad y Estadística N° 9
P. 99
The primary balance is the overall fiscal balance excluding has a relevant foreign currency component (as it is the
net interest payments on public debt. It illustrates the case in several LAC countries), creating vulnerability to
extent to which governments can honour their debt external conditions.
obligations without the need for further indebtedness.
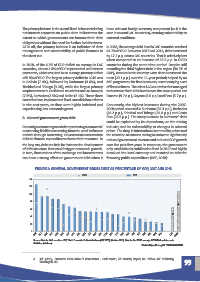
All in all, the primary balance is an indicator of debt In 2018, the average debt level in LAC countries reached
management and sustainability of public finances in 64.7% of GDP. Between 2007 and 2018, debt increased
the short run. by 17.2 p.p. across LAC countries. That is relatively low
when compared to an increase of 35.5 p.p. in OECD
In 2018, of the 4.3% of GDP deficit on average in LAC countries during the same time period. Despite still
countries, almost 3.8% of GDP represented net interest recording the third highest debt in the region (94.3% of
payments, which resulted in an average primary deficit GDP), Jamaica is the country were debt decreased the
of 0.5% of GDP. The largest primary deficit in 2018 was most (20.1 p.p.) over the 11-year period; helped by an
in Bolivia (7.0%), followed by Suriname (3.6%), and IMF programme for fiscal recovery accompanying a set
Trinidad and Tobago (3.0%), while the largest primary of fiscal reforms. The other LAC countries that managed
surpluses were in Caribbean countries such as Jamaica to decrease their debt levels over the same period are
(7.5%), Barbados (3.5%) and Belize (2.1%). These three Panama (9.7 p.p.), Guyana (8.0 p.p.) and Peru (5.7 p.p.).
countries have implemented fiscal consolidation reforms
in the past years, as they were highly indebted and Conversely, the highest increases during the 2007-
experiencing low economic growt. 2018 period occurred in Suriname (55.3 p.p.), Barbados
(48.3 p.p.), Trinidad and Tobago (28.8 p.p.) and Costa
B. General government gross debt Rica (26.5 p.p.). The steep increase in Suriname’ debt
could be explained by its dependency on the mining
General government gross debt represents governments’ industry and its vulnerability to changes in mineral
outstanding liabilities stemming from the need to finance prices. The drop in international commodity prices and
deficits through borrowing. Governments accumulate the cessation of alumina mining in Suriname significantly
debt to finance expenditures above their revenues. In reduced government revenue and reduced GDP growth
the long run, debt can help for instance the development over the past few years. In response, the government
of infrastructure that could trigger economic growth. only established a stabilization fund in 2017 and highly
In turn, fluctuations of the exchange and interest rates devalued the local currency and resorted to debt for
can have a strong effect on government debt when it financing public expenditure (IMF, 2018) .
4
2.3. GENERAL GOVERNMENT GROSS DEBT
FIGURE 2: GENERAL GOVERNMENT GROSS DEBT AS PERCENTAGE OF GDP, 2007 AND 2018
2.5. General government gross debt as percentage of GDP, 2007 and 2018
2007 2018
140
120
100
80
60
40
20
0
BRB BLZ JAM BRA ARG SUR SLV URY BOL MEX CRI GUY COL DOM ECU TTO HND PAN NIC HTI PER CHL GTM PRY LAC OECD
Source: Data for LAC countries: IMF, World Economic Outlook database (IMF WEO) (October 2019). Data for the OECD average: OECD National Accounts
Source: Data for LAC countries: imF, World Economic Outlook database (imF WEO) (October 2019). Data for the OECD average: OECD national Accounts
Statistics (database).
Statistics (database).
Statlink https://doi.org/10.1787/888934091220
12 https://doi.org/10.1787/888934091220
2.6. General government gross debt per capita, 2007 and 2018
4 IMF (2018), “Suriname: 2018 Article IV Consultation – Staff report”, IMF Country Report, No. 18/376, IMF Publishing,
2007
2018
60 000 Washington, DC. 99
55 000
50 000
45 000
40 000
35 000
30 000
25 000
20 000
15 000
10 000
5 000
0
BRB ARG URY TTO BRA MEX SUR PAN CRI DOM JAM BLZ COL CHL SLV ECU GUY BOL PER PRY HND GTM NIC HTI LAC OECD
Source: Data for LAC countries: imF, World Economic Outlook database (imF WEO) (October 2019). Data for the OECD average: OECD national Accounts
Statistics (database).
12 https://doi.org/10.1787/888934091239
GOvErnmEnt At A GLAnCE: LAtin AmEriCA AnD thE CAribbEAn 2020 © OECD 2020 57