
Page 97 - Revista del Centro de Investigación y Desarrollo del INEI - Economía, Sociedad y Estadística N° 9
P. 97
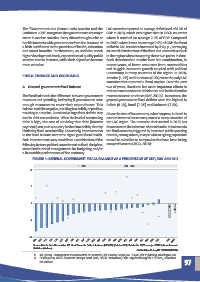
The “Government at a Glance: Latin America and the  LAC countries reported an average deficit level of 4.3% of
              Caribbean 2020” recognises that governments are major  GDP in 2018, which was higher than in OECD countries
              actors in modern societies. Every citizen throughout his or  where it reached on average 2.9% of GDP. Compared
              her life interacts with governments from the issuance of  to 2007, when it was on average 0.9% of GDP the fiscal
              a birth certificates to the provision of health, education  deficit in LAC countries increased by 3.4 p.p., portraying
              and social benefits. Furthermore, as societies reach  an overall deterioration of the fiscal and economic outlook
              higher development levels, expectations of quality public  in the region when comparing these two points in time.
              services tend to increase, while their objectives become  Such deterioration results from the combination, in
              more complex.                                     recent years, of fewer resources from commodities
                                                                and sluggish economic growth coupled with political
                                                                uncertainty in many countries of the region. In 2018,
              PUBLIC FINANCE AND ECONOMICS
                                                                Jamaica (1.2%) and Honduras (0.2%) were the only LAC
                                                                countries that reported a fiscal surplus. Over the past
              A.   General government fiscal balance            two of years, Honduras has made important efforts to
                                                                reduce macroeconomic imbalances and institutionalise
              The fiscal balance is the difference between government  macroeconomic prudence (IMF, 2019)2. In contrast, the
              revenues and spending, indicating if governments raise  general government fiscal deficits were the highest in
              enough resources to cover their expenditures. This  Bolivia (8.1%), Brazil (7.2%) and Suriname (7.2%).
              balance could be negative, resulting in a deficit, or positive,
              resulting in a surplus. Consecutive large fiscal deficits may  Given the size of its economy, what happens in Brazil in
              lead to debt accumulation. When the level of outstanding  economic terms has consequences in many countries of
              debt is high, the cost of servicing that debt (interest  the LAC region. The recession that started in 2015 has
              payments) can push a country further into deficit, thereby  demonstrated the existence of considerable imbalances in
              hindering fiscal sustainability. Conversely, improvements  the fiscal accounts, triggered by increased public spending
              in the fiscal balance over time signal good fiscal health.  needed, among others, to cope with an ageing population
              Such improvements may result from a combination of the  as well as subsidies to companies that have been losing
              following factors: political commitment to fiscal discipline,  competitiveness (OECD, 2018) .
                                                                                          3
              sound institutional arrangements for budgeting and/or      2.1. BALANCE FISCAL DE LA ADMINISTRACIÓN PÚBLICA
              a favourable performance of the economy.
                    FIGURE 1: GENERAL GOVERNMENT FISCAL BALANCE AS A PERCENTAGE OF GDP, 2007 AND 2018
                            2.1. Balance fiscal de la administración pública como porcentaje del PIB, 2007 y 2018
                                                 2007                         2018
                   10


                   5


                   0


                   -5


                  -10
                     BOL  BRA  SUR  CRI  TTO  ARG  GUY  NIC  COL  SLV  DOM  MEX  URY  PAN  HTI  PER  GTM  CHL  PRY  ECU  BLZ  BRB  HND  JAM  ALC  OCDE
                     Source: Data for the LAC countries, IMF, World Economic Outlook database (IMF WEO) (October 2019). Data for the OECD average: OECD National Accounts
                 Fuentes: Datos para los países de ALC: FMI, base de datos de World Economic Ooutlook (WEO, por sus siglas en inglés) (octubre de 2019). Datos para el
                     Statistics (database).
                 promedio de la OCDE: Estadísticas de Cuentas Nacionales de la OCDE (base de datos).  Statlink https://doi.org/10.1787/888934091144
                                                                           12 http://dx.doi.org/10.1787/888934094146
                      2   IMF (2019), “Staff report for the 2019 Article IV Honduras”, IMF Country Report, No.  19/236, IMF Publishing, Washington, DC.
                         OECD (2018), OECD Economic Surveys: Brazil 2018, OECD Publications, Paris. http://dx.doi.org/110.1787/eco_ encuestas-
                      3
                     2.2. Balance primario de la administración pública y gasto de intereses netos como porcentaje del PIB,
                         bra-2018-en.                     2007 y 2018                                         97
                   %         Balance primario, 2018  Intereses netos, 2018  Balance primario, 2007  Intereses netos, 2007
                   14
                   12
                   10
                   8

                   6
                   4
                   2
                   0

                   -2
                   -4
                   -6

                   -8
                     BOL  SUR  TTO  GUY  CRI  ARG  NIC  HTI  BRA  CHL  PER  GTM  PAN  PRY  COL  DOM  URY  HND  SLV  ECU  MEX  BLZ  BRB  JAM  ALC  OCDE
                 Fuentes: Datos para los países de ALC: FMI, base de datos de World Economic Ooutlook (WEO, por sus siglas en inglés) (octubre de 2019). Datos para el
                 promedio de la OCDE: Estadísticas de Cuentas Nacionales de la OCDE (base de datos).
                                                                           12 http://dx.doi.org/10.1787/888934094165


                 PANORAMA DE LAS ADMINISTRACIONES PÚBLICAS: AMÉRICA LATINA Y EL CARIBE 2020 © OECD 2020   57