
Page 45 - Revista del Centro de Investigación y Desarrollo del INEI - Economía, Sociedad y Estadística N° 9
P. 45
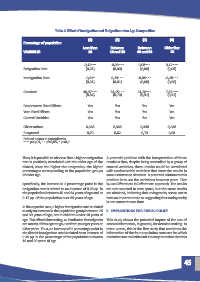
Table 4: Effect of Immigration and Emigration rates Age Composition


                                                     (1)             (2)              (3)             (4)
               Percentage of population
                                                  Less than        Between         Between        Older than
               VARIABLES                             18           18 and 39       40 and 64           65


                                                   -0,12***        -0,08***        0,08***         0,12***
               Emigration Rate                      (0,01)          (0,00)          (0,00)          (0,00)


               Immigration Rate                     -0,01*         0,19***         -0,08***        -0,10***
                                                    (0,01)          (0,01)          (0,00)          (0,00)

               Constant                           46,97***        24,15***         21,26***        7,62***
                                                    (0,84)          (0,70)          (0,51)          (0,51)


               Department Fixed Effects              Yes             Yes             Yes             Yes

               Year Fixed Effects                    Yes             Yes             Yes             Yes
               Control Variables                     Yes             Yes             Yes             Yes

               Observations                         6,348           6,348           6,348           6,348
               R-squared                             0,79            0,62            0,73            0,68
               Robust errors in parenthesis.
               *** p<0,01, ** p<0,05, * p<0,1


              Thus, it is possible to observe that a higher emigration  A potential problem with the interpretation of these
              rate is positively correlated with the older age of the  results is that, despite being controlled by a group of
              district, since the higher the emigration, the higher  control variables, these results could be correlated
              percentages corresponding to the population groups  with unobservable variables that skew the results in
              of older age.                                     some unforeseen direction. A potential solution to this
                                                                problem is to use the variations between years. That
              Specifically, the increase in 1 percentage point in the  is, use Differences in Differences approach. The results
              emigration rate is related to an increase of 0.08 pp. in  are not reported to save space, but the same results
              the population between 40 and 64 years of age and at  are obtained, indicating that endogeneity seems not to
              0.12 pp. of the population over 65 years of age.  have an important role or suggesting that endogeneity
                                                                is not constant over time.
              In the opposite case, a higher immigration rate is related
              to only an increase in the population group between 18  5.  IMPLICATIONS FOR PUBLIC POLICY
              and 39 years of age, not in children under 18 years of
              age. This effect is interesting, as it indicates that migrants  This study shows the potential impact of the use of
              are mostly of this age range, not from younger years or  census information, in general, for decision making. In
              older years. Thus, an increase of 1 percentage point in  other words, this is the first study that combines the
              the district immigration rate is related to an increase of  information of the four population censuses for which
              0.19 pp. in the percentage of the population between  microdata are available and it is easy to realize that this
              18 and 39 years of age.


                                                                                                              45