
Page 37 - Revista del Centro de Investigación y Desarrollo del INEI - Economía, Sociedad y Estadística N° 9
P. 37
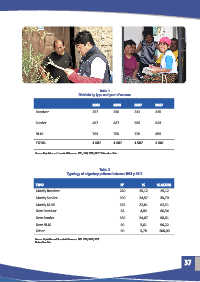
Table 1
                                               Districts by type and year of census


                                                        1981        1993        2007         2017

                      Receiver                          357         350         311          315


                      Sender                            467         487         556          813


                      Ni-Ni                             763         750         720          459

                      TOTAL                             1 587       1 587       1 587        1 587


                      Source: Population and Household Censuses 1981, 1993, 2007 y 2017. Elaboration: Own.


                                                            Table 2
                                        Typology of migratory patterns between 1981 y 2017


                      TIPO                                              N°           %        % ACUM.
                      Mostly Receiver                                   240        15,12        15,12

                      Mostly Sender                                     390        24,57        39,70
                      Mostly Ni-Ni                                      362        22,81        62,51

                      New Receiver                                      64          4,03        66,54
                      New Sender                                        382        24,07        90,61

                      New Ni-Ni                                         89          5,61        96,22
                      Other                                             60          3,78       100,00

                      Source: Population and Household Censuses 1981, 1993, 2007 y 2017.
                      Elaboration: Own.


                                                                                                              37